2013 Season
A Year in Review
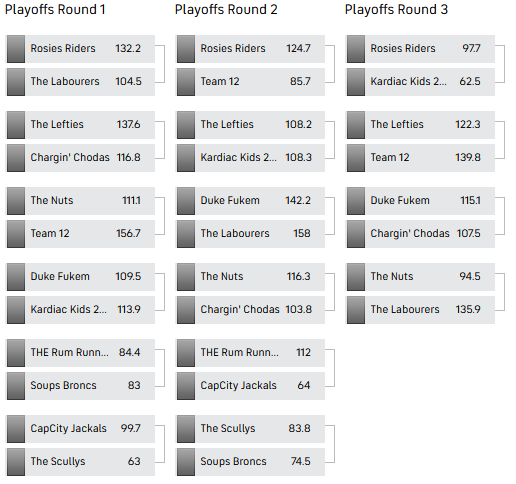
'There can be only one.' This season, that was Rosies Riders. They finished off 2013 with a 97.7 to 62.53 victory over Kardiac Kids 2010 Champ, giving them a 13 - 3 final record. That impressive record was partially a result of great coaching, as nobody earned their team more points with their lineup decisions than Coach Brent Rose.
Coach Perry Campbell, on the other hand, had lots of trouble coaching, and the results sure showed. Soups Broncs wound up at 1 - 14, good for the worst record in the league. Colin Kaepernick also deserves a big chunk of the blame for Soups Broncs' ugly record, as he scored 54 points less than the average quarterback while in the starting lineup.
All in all, there were injuries, surprise standouts and smart waiver moves that certainly made for an exciting race to the finish. And while Rosies Riders may be holding on tightly to their title as Big Balls Fantasy Football League champion until next year, Fantasy Football doesn't have to be over just yet. Lucky for all, Playoff Challenge still offers one more chance to compete for a victory (and a cash prize) this postseason!
Rod Marinelli Award
Key Stat: Average Coach's Points: -4 Coach Roger Matchett's Points: -45
Coach Matchett has plenty of decisions to regret after his lineup choices left him as the worst gameday coach in the league. He sure distributed those lost points well however, as he never cost his team a game with his decisions. Duke Fukem wrapped up the regular season tied for having the 3rd best record at 8 - 5.
Even-Keeled
Key Stat: The Scullys Top 3 Players PPA: 33 The Scullys 4-6 Players PPA: 13
It was all for one and one for all with The Scullys this season, as they ended up with the most balanced lineup in the league. Unfortunately, this was more due to their top players not doing so well. Rob Gronkowski, C.J. Spiller, and Josh Gordon posted a +33 Points Vs Positional Average (PPA) while in the starting lineup this year, one of the worst marks in the league. Their next three best players, Adam Vinatieri, Julius Thomas, and Alfred Morris, finished up at +13 PPA.
Mirror Mirror
Key Stat: Record When A.J. Green Overperforms: 4 - 2 Record When A.J. Green Underperforms: 2 - 7
There was no better indicator of Chargin' Chodas' fortunes this year than the performance of A.J. Green. Chargin' Chodas looked hopeless when Green failed to hit his projections, and totally legit when he did. Coach Mark Chodos could have used a lot more good efforts from Green, as they closed the season at 7 - 9.
Someone Knows How the Houston Texans Feel
Key Stat: Points Per Game Weeks 1 - 5: 107 Points Per Game Weeks 6 - 15: 92
Back in week five, CapCity Jackals were in contention to win the title, tied for 3rd place. Unfortunately, it was not meant to be, as they fell all the way to 10th place to finish the season with a record of 5 - 8. The unimpressive finish was partially due to CapCity Jackals' 9th ranked wide receivers.
Bully
Key Stat: Record Vs. Above 0.500 Teams: 2 - 7 Record Vs. Below 0.500 Teams: 4 - 0
THE Rum Runner made their bones beating the dregs of the league, but struggled big time against top competition. Their inability to come through in tough games doomed them to a 6 - 7 regular season record. THE Rum Runner were also hurt by the wasted draft pick of C.J. Spiller, who scored a paltry 138.1 points this season.
Running Man
Key Stat: Average Running Back Points Per Game: 12 Jamaal Charles Points Per Game: 23
The Labourers leaned on Jamaal Charles all year, as he was the league's best running back, scoring 344 points. Charles' best game came in week 15, when he put up 56 points in leading The Labourers to victory over Duke Fukem. In part because of his efforts, The Labourers finished up tied for the 5th best regular season record in the league at 7 - 6.
Golden Group
Key Stat: Average WR Points/Week: 26 The Lefties WR Points/Week: 33
The Lefties got big efforts from their wide receivers, who put up 33.11 points per game, which was the best in the league. Josh Gordon was the leader of the pack, scoring 137 points for The Lefties this season. The strong wide receiver group helps explain why The Lefties finished the regular season with a 9 - 4 record.
So Close...
Key Stat: Kardiac Kids 2010 Champ: 62.53 Rosies Riders: 97.7
Kardiac Kids 2010 Champ came so close and yet were so far, winding up in second place. Their season closed with the sour note of a playoff loss to Rosies Riders, but overall they did well enough to end up with a 10 - 6 record. Coach Dan Leslie had a hand in the impressive record, since they were the 4th best gameday coach in the league.
Nobody Does It Better
Key Stat: Rosies Riders: 97.7 Kardiac Kids 2010 Champ: 62.53
'There can be only one.' This season, that was Rosies Riders. They finished off 2013 with a 97.7 to 62.53 victory over Kardiac Kids 2010 Champ, giving them a 13 - 3 final record. Pierre Garcon contributed 26 points in the big win.
Ownage
Key Stat: The Nuts: 261 points Soups Broncs: 125 points
The Nuts didn't have a great year, but Soups Broncs sure wouldn't believe that. The Nuts faced Soups Broncs two times, and ended up winning both games. The cumulative margin of victory, at 136 points, represents the largest spread between any two teams this year.
Catching Fire
Key Stat: Team 12 Regular Season Wins: 7 Team 12 Wins During weeks 9-14: 5
As Coach Carey Belyea looks back on the season, he will no doubt fondly remember weeks 9 to 14 when Team 12 looked like world-beaters. They went 5 - 1 over that happy stretch. LeSean McCoy was the key, going 48 points over his positional average during that span. Overall, Team 12 finished in 5th place during the regular season with a record of 7 - 6.
It Couldn't Be Worse
Key Stat: Average Team Points (reg. season): 1325 Soups Broncs Points (reg. season): 1007
There's always next year for Coach Campbell. This year, however, Soups Broncs wound up in last place in the overall standings at 1 - 14. Colin Kaepernick deserves a big chunk of the blame for Soups Broncs' ugly record, as he scored 54 points less than the average quarterback while in the starting lineup.
2013 Champions
| Place | Team |
|---|---|
 |
Rosies Riders |
 |
Kardiac Kids |
 |
Team 12 |
League Records
Note
League Records not available in CBS
Final Standings
East Division
| Team | W | L | T | PCT | PF | PA | Wks |
|---|---|---|---|---|---|---|---|
| The Lefties | 9 | 4 | 0 | 0.692 | 1528.2 | 1398.1 | 5 |
| The Nuts | 7 | 6 | 0 | 0.538 | 1409.0 | 1231.6 | 2 |
| Team 12 | 7 | 6 | 0 | 0.538 | 1356.1 | 1387.7 | 0 |
| THE Rum Runner | 6 | 7 | 0 | 0.462 | 1343.0 | 1353.6 | 0 |
| The Scullys | 3 | 10 | 0 | 0.231 | 1213.0 | 1353.8 | 0 |
| Soups Broncs | 1 | 12 | 0 | 0.077 | 1006.8 | 1457.0 | 0 |
West Division
| Team | W | L | T | PCT | PF | PA | Wks |
|---|---|---|---|---|---|---|---|
| Rosies Riders | 10 | 3 | 0 | 0.769 | 1403.0 | 1249.3 | 1 |
| Duke Fukem | 8 | 5 | 0 | 0.615 | 1397.9 | 1277.8 | 3 |
| Kardiac Kids 2010 Champ | 8 | 5 | 0 | 0.615 | 1314.6 | 1216.5 | 0 |
| Chargin' Chodas | 7 | 6 | 0 | 0.538 | 1403.9 | 1401.4 | 2 |
| The Labourers | 7 | 6 | 0 | 0.538 | 1251.2 | 1226.9 | 0 |
| CapCity Jackals | 5 | 8 | 0 | 0.385 | 1269.0 | 1341.9 | 0 |
Playoff Bracket