2016 Season
A Year in Review
Antonio Brown and CapCity Dragoons take the crown
'There can be only one.' This season, that was CapCity Dragoons. They finished off 2016 with a 132.04 to 115.98 victory over Team 12, giving them a 9 - 7 final record. Coach Geoff Bourgeault had a hand in the impressive record, since they were the 2nd best gameday coach in the league.
When it came to coaching though, nobody was better than Coach Carey Belyea. He stood out as the best decision-maker this year, giving his squad 33.4 more points than the experts would have. That was 82 points better than Coach Stephane, who was the worst coach in the league. He ended up costing his team the game in week 14 with his lineup decisions, which were 7.1 points worse than the experts that week.
Coach Shannon and Mike didn't need to do a lot of coaching when it came to their wide receivers, who put up a league-leading 36.36 points per game. Julio Jones was the leader of that pack, scoring 191.3 points for Lights Out! this season. Meanwhile, Coach Dan Leslie could only dream about good wide receiver play this year, as Kardiac Kids' wide receivers were the worst in the league, coming up with only 22.21 points per game.
Rockland Bruisers had lots of positional problems, which drove them into the ditch at 4 - 11. That was the worst mark in the league. The fact that Rockland Bruisers had the 2nd hardest schedule this year (measured by points against) certainly had something to do with that.
You're Not Helping
Key Stat: Average Coach's Points: -15.7 Coach Stephane's Points: -48.6
Coach Stephane has plenty of decisions to regret after his lineup choices left him as the worst gameday coach in the league. He ended up costing his team the game in week 14 with his lineup decisions, which were 7.1 points worse than the experts that week. Despite that coaching performance, FieldGoats wrapped up the regular season tied for having the 3rd best record at 7 - 6.
Literally the Worst
Key Stat for The Scullys: Average Quarterback Points Per Game: 24.8 Russell Wilson Points Per Game Started: 20.1
Russell Wilson stunk it up so badly that The Scullys will have to shower all off season to get off the stink. Wilson was the worst player in the league, scoring 46.9 points less than the average quarterback while in the starting lineup. Wilson's worst game came in week 14, when he couldn't do any better than 9.9 points in a losing effort versus Kardiac Kids. Despite his performance this year, The Scullys finished the regular season with a 9 - 4 record.
King of the League
Key Stat: CapCity Dragoons: 132.04 Team 12: 115.98
All twelve teams started the 2016 season with dreams of a championship, but only CapCity Dragoons and Coach Geoff Bourgeault made it a reality. CapCity Dragoons finished off 2016 with a 132.04 to 115.98 victory over Team 12, giving them a 9 - 7 final record. Travis Kelce contributed 27.5 points in the big win.
Following the Script
Key Stat for Rosies Riders: Record Vs. Above 0.500 Teams: 1 - 4 Record Vs. Below 0.500 Teams: 6 - 2
Rosies Riders mopped up the bottom dwellers in the league, but struggled big time against top competition. Their mastery over bottom dwellers ended up being enough to give them a 7 - 6 regular season record. Rosies Riders' good standing can also be attributed, in part, to their wide receivers, who ranked 3rd in the league.
So Close...
Key Stat: Team 12: 115.98 CapCity Dragoons: 132.04
Team 12 came so close and yet were so far, winding up in second place. Their season closed with the sour note of a playoff loss to CapCity Dragoons, but overall they did well enough to end up with a 9 - 7 record. They were led by Tom Brady, Devonta Freeman, and Luke Kuechly, who collectively finished 102.8 points above their positional averages while in the starting lineup.
Enjoy the Show
Key Stat for Pigskin Wizards: Getting to watch Odell Beckham
Pigskin Wizards might not have had the most enjoyable season in the standings, but at least they got to watch Odell Beckham. ODB caught a one-handed touchdown reception (natch) and also looked like the second coming of Jerry Rice on this slant route TD. Having plenty of highlight moments helped him put up a total of 241.9 points for the season.
Golden Group
Key Stat: Average WR Points/Week: 29.3 Lights Out! WR Points/Week: 36.4
Lights Out! got big efforts from their wide receivers, who put up a best-in-the-league 36.36 points per game. Julio Jones was the key member of that stalwart corps, scoring 191.3 points for Lights Out! this season. The strong wide receiver group helps explain why Lights Out! finished up tied for the 3rd best regular season record in the league at 7 - 6.
Knowing the Role
Key Stat for Kardiac Kids: Average Quarterback Points Per Game: 24.8 Aaron Rodgers Points Per Game Started: 33.2
Kardiac Kids leaned on Aaron Rodgers heavily, as he was the league's best quarterback, scoring 459.7 points. Coach Dan Leslie brought Rodgers over in a week six trade. That was good timing, as he was on the team in week 16, when Rodgers dropped 48.7 points.
Better Luck Next Year
Key Stat: Average Team Points per Game (reg. season): 110 Rockland Bruisers Points per Game (reg. season): 95.1
There's always next year for Coach Matchett. This year, however, Rockland Bruisers wound up in last place in the overall standings at 4 - 11. Coach Matchett can blame himself for part of that bad record seeing as he was the 10th ranked gameday coach in the league.
Ares Championship
| Place | Team |
|---|---|
 |
CapCity Dragoons |
 |
Team 12 |
 |
Kardiac Kids |
League Records
| Record | Team | Value |
|---|---|---|
| Most Points Scored, Season | The Nuts | 1547.0 |
| Least Points Scored, Season | Full tilt full time | 1196.3 |
| Most Points Allowed, Season | Kardiac Kids | 1551.1 |
| Least Points Allowed, Season | FieldGoats | 1302.0 |
| Highest Average Game Score, Season | The Nuts | 119.00 |
| Lowest Average Game Score, Season | Full tilt full time | 92.02 |
| Most Points Scored, Game | Lights Out! | 178.8300 |
| Least Points Scored, Game | Rockland Bruisers | 47.6000 |
| Most Points Allowed, Game | Kardiac Kids | 178.8300 |
| Least Points Allowed, Game | Full tilt full time | 47.6000 |
| Highest Winning Percentage, Season | The Nuts | 0.846 |
| Lowest Winning Percentage, Season | Full tilt full time | 0.231 |
| Most Wins, Season | The Nuts | 11 |
| Least Wins, Season | Full tilt full time | 3 |
| Best Margin of Victory, Game | Pigskin Wizards | 74.32 |
| Worst Margin of Defeat, Game | Full tilt full time | -74.32 |
| Best Average Point Differential, Season | The Nuts | 13.42 |
| Worst Average Point Differential, Season | Full tilt full time | -21.38 |
| Longest Winning Streak, Season | The Nuts | 11 |
| Longest Losing Streak, Season | Full tilt full time | 7 |
| Best Power Ranking, Season | The Nuts | 33 |
| Worst Power Ranking, Season | Full tilt full time | 3.5 |
| Most High Week Scores, Season | FieldGoats | 3 |
Final Standings
East Division
| Team | W | L | T | PCT | PF | PA | Wks |
|---|---|---|---|---|---|---|---|
| The Nuts | 11 | 2 | 0 | 0.846 | 1547.0 | 1372.5 | 2 |
| The Scullys | 9 | 4 | 0 | 0.692 | 1462.4 | 1393.9 | 1 |
| Team 12 | 7 | 6 | 0 | 0.538 | 1433.6 | 1398.8 | 0 |
| CapCity Dragoons | 6 | 7 | 0 | 0.462 | 1507.5 | 1442.2 | 1 |
| THE WHIPPER | 6 | 7 | 0 | 0.462 | 1471.5 | 1457.8 | 1 |
| Full tilt full time | 3 | 10 | 0 | 0.231 | 1196.3 | 1474.2 | 0 |
West Division
| Team | W | L | T | PCT | PF | PA | Wks |
|---|---|---|---|---|---|---|---|
| Rosies Riders | 7 | 6 | 0 | 0.538 | 1525.0 | 1460.3 | 2 |
| Lights Out! | 7 | 6 | 0 | 0.538 | 1478.2 | 1384.1 | 1 |
| FieldGoats | 7 | 6 | 0 | 0.538 | 1367.6 | 1302.0 | 3 |
| Kardiac Kids | 6 | 7 | 0 | 0.462 | 1527.5 | 1551.1 | 0 |
| Pigskin Wizards | 6 | 7 | 0 | 0.462 | 1411.8 | 1428.0 | 1 |
| Rockland Bruisers | 3 | 10 | 0 | 0.231 | 1236.0 | 1499.4 | 1 |
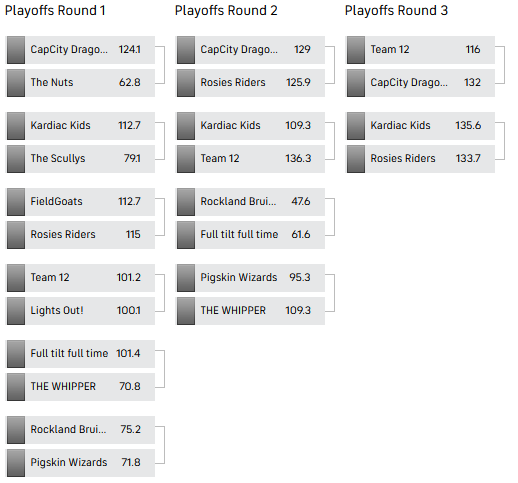
Playoff Bracket