2019 Season
A Year in Review
Lamar Jackson and CJ2K take the crown
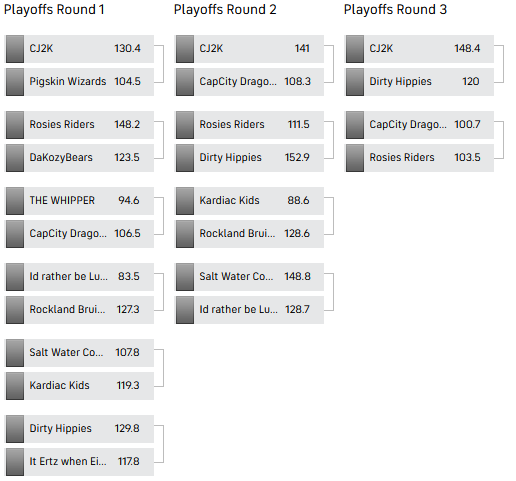
When it is all said and done, Coach Vedran Radojevic will have the bragging rights for this entire offseason. CJ2K finished off 2019 with a 148.4 to 119.95 victory over Dirty Hippies, giving them a 12 - 4 final record. That impressive record was partially a result of great coaching, as nobody earned their team more points with their lineup decisions than Coach Radojevic.
Coach Stephane didn't need to do a lot of coaching when it came to their wide receivers, who put up a league-leading 42.42 points per game. Michael Thomas was the key member of that stalwart corps, scoring 281.3 points for Dirty Hippies this season. Meanwhile, Coaches Greg Watson and Greg Watson could only dream about good wide receiver play this year, as THE WHIPPER's wide receivers were the worst in the league, coming up with only 22.19 points per game.
Kardiac Kids had lots of positional problems, which drove them into the ditch at 5 - 10. That was the worst mark in the league. Jared Goff deserves a big chunk of the blame for their ugly record, as he scored 56.1 points less than the average quarterback while in the starting lineup.
Work Horse
Key Stat for CapCity Dragoons: Average Running Back Points Per Game: 12.8 Christian McCaffrey Points Per Game Started: 26.3
CapCity Dragoons leaned on Christian McCaffrey all year, as he was the league's best running back, scoring 413.2 points. McCaffrey's best game came in week five, when he put up 44.7 points in a losing effort versus CJ2K. CapCity Dragoons ran their way to a 7 - 6 regular season record.
Nobody Does It Better
Key Stat: CJ2K: 148.4 Dirty Hippies: 119.95
'There can be only one.' This season, that was CJ2K. They finished off 2019 with a 148.4 to 119.95 victory over Dirty Hippies, giving them a 12 - 4 final record. That impressive record was partially a result of great coaching, as nobody earned their team more points with their lineup decisions than Coach Vedran Radojevic.
Throw That Clipboard
Key Stat: Average Coach's Points: -3 Coach Roger Matchett's Points: -52.6
Coach Matchett has plenty of decisions to regret after his lineup choices left him as the worst gameday coach in the league. He ended up costing his team the game in week eight with his lineup decisions, which were 33.5 points worse than the experts that week. That coaching performance goes a long way towards explaining why Rockland Bruisers finished the regular season with a 3 - 10 record.
Fizz Out
Key Stat: Id rather be LuckY Regular Season Losses: 7 Id rather be LuckY Losses During weeks 4-8: 4
As Coach Luc Richard wonders why Id rather be LuckY failed to make the playoffs, they will have to think about weeks 4 to 8 when Id rather be LuckY looked like the worst team in the league. They went 1 - 4 over that unhappy stretch. Odell Beckham should shoulder much of the blame, doing 17.7 points worse than the average wide receiver while in the starting lineup during that span. Id rather be LuckY wound up in 8th place during the regular season with a 6 - 7 record.
Tough Road
Key Stat: Average Points Scored per Game: 109.8 It Ertz when Eifert Opponents per Game: 117.5
Coach Carey Belyea probably got sick of having to walk uphill all year long. It Ertz when Eifert's opponents put up 117.5 points per game during the regular season, which was more points than any other team had to deal with. Despite that, It Ertz when Eifert wrapped up the regular season in 4th place with an 8 - 5 record.
Even-Keeled
Key Stat: Pigskin Wizards Top 3 Players PPA: 44.9 Pigskin Wizards 4-6 Players PPA: 14.5
It was all for one and one for all with Pigskin Wizards this season, as they ended up with the most balanced lineup in the league. Unfortunately, this was more due to their top players not doing so well. Jarvis Landry, Josh Jacobs, and Miles Sanders posted 44.9 Points Vs Positional Average (PPA) while in the starting lineup this year, one of the worst marks in the league. Their next three best players, Phillip Lindsay, D.J. Chark, and D.K. Metcalf, finished up at +14.5 PPA.
Problem Children
Key Stat: Average WR Points/Week: 29.7 THE WHIPPER WR Points/Week: 22.2
THE WHIPPER struggled to find the right mix with their wide receivers, who averaged only 22.19 points per game. That was worse than any other team this year. Tyler Boyd shares a big part of the blame for that lackluster group's performance, averaging 9.4 points in his 10 starts for THE WHIPPER this year. Despite those wide receiver problems, THE WHIPPER wrapped up the regular season tied for having the best record at 9 - 4.
It Couldn't Be Worse
Key Stat: Average Team Points per Game (reg. season): 109.8 Salt Water Cowboys Points per Game (reg. season): 99.2
There's always next year for Coach Chris Pitcher. Salt Water Cowboys wound up tied with Kardiac Kids and Rockland Bruisers for last place with a record of 5 - 10. The unimpressive finish was partially due to their 10th ranked wide receivers.
You've Got a 'Tell'
Key Stat for Dirty Hippies: Record When Zach Ertz Overperforms: 6 - 0 Record When Zach Ertz Underperforms: 1 - 5
It was pretty simple, if Zach Ertz had a good game Dirty Hippies weren't losing. Dirty Hippies looked unstoppable when Ertz topped his projections, and hopeless when he didn't. Coach Stephane got enough good efforts from Ertz to wind up at 9 - 7.
Literally the Worst
Key Stat for Kardiac Kids: Average Quarterback Points Per Game: 24.6 Jared Goff Points Per Game Started: 19.4
Jared Goff stunk it up so badly that Kardiac Kids will have to shower all off season to get off the stink. Goff was the worst player in the league, scoring 56.1 points less than the average quarterback while in the starting lineup. Goff's worst game came in week six, when he couldn't do any better than 1.9 points in a losing effort versus THE WHIPPER. The bad performance of Goff helps explain why Kardiac Kids wound up tied for the 2nd worst regular season record in the league at 4 - 9.
Ares Championship
| Place | Team |
|---|---|
 |
CJ2K |
 |
Dirty Hippies |
 |
Rosies Riders |
League Records
| Record | Team | Value |
|---|---|---|
| Most Points Scored, Season | CJ2K | 1620.5 |
| Least Points Scored, Season | Kardiac Kids | 1209.8 |
| Most Points Allowed, Season | It Ertz when Eifert | 1528.1 |
| Least Points Allowed, Season | CJ2K | 1326.2 |
| Highest Average Game Score, Season | CJ2K | 124.65 |
| Lowest Average Game Score, Season | Kardiac Kids | 93.06 |
| Most Points Scored, Game | Rosies Riders | 167.3500 |
| Least Points Scored, Game | Kardiac Kids | 45.4500 |
| Most Points Allowed, Game | Dirty Hippies | 167.3500 |
| Least Points Allowed, Game | CJ2K | 45.4500 |
| Highest Winning Percentage, Season | Rosies Riders | 0.692 |
| Lowest Winning Percentage, Season | Rockland Bruisers | 0.231 |
| Most Wins, Season | Rosies Riders | 9 |
| Least Wins, Season | Rockland Bruisers | 3 |
| Best Margin of Victory, Game | CapCity Dragoons | 101.15 |
| Worst Margin of Defeat, Game | THE WHIPPER | -101.15 |
| Best Average Point Differential, Season | CJ2K | 22.64 |
| Worst Average Point Differential, Season | Kardiac Kids | -16.89 |
| Longest Winning Streak, Season | CJ2K | 6 |
| Longest Losing Streak, Season | Rockland Bruisers | 6 |
| Best Power Ranking, Season | CJ2K | 34 |
| Worst Power Ranking, Season | Kardiac Kids | 5.5 |
| Most High Week Scores, Season | CJ2K | 3 |
Final Standings
East Division
| Team | W | L | T | PCT | PF | PA | Wks |
|---|---|---|---|---|---|---|---|
| CJ2K | 9 | 4 | 0 | 0.692 | 1620.5 | 1326.2 | 3 |
| THE WHIPPER | 9 | 4 | 0 | 0.692 | 1402.1 | 1375.3 | 1 |
| It Ertz when Eifert | 8 | 5 | 0 | 0.615 | 1494.9 | 1528.1 | 2 |
| CapCity Dragoons | 7 | 6 | 0 | 0.538 | 1516.1 | 1346.0 | 1 |
| DaKozyBears | 7 | 6 | 0 | 0.538 | 1460.6 | 1390.7 | 1 |
| Id rather be LuckY | 6 | 7 | 0 | 0.462 | 1398.2 | 1447.1 | 1 |
West Division
| Team | W | L | T | PCT | PF | PA | Wks |
|---|---|---|---|---|---|---|---|
| Rosies Riders | 9 | 4 | 0 | 0.692 | 1569.2 | 1365.3 | 2 |
| Dirty Hippies | 7 | 6 | 0 | 0.538 | 1587.1 | 1482.8 | 1 |
| Pigskin Wizards | 5 | 8 | 0 | 0.385 | 1218.9 | 1421.3 | 0 |
| Salt Water Cowboys | 4 | 9 | 0 | 0.308 | 1290.3 | 1504.0 | 0 |
| Kardiac Kids | 4 | 9 | 0 | 0.308 | 1209.8 | 1429.4 | 1 |
| Rockland Bruisers | 3 | 10 | 0 | 0.231 | 1363.9 | 1515.3 | 0 |
Playoff Bracket